VBarChart
A VBarChart draws one vertical bar for each value in a numeric series. The value type T is any numeric type that implements Number: i8, i16, i32, i64, i128, u8, u16, u32, u64, u128, usize, isize, f32, or f64.
The chart maps those values onto the plot height, and can show a Y axis with a grid, labels under the bars, and a horizontal scroll bar when the series is wider than the control. Each bar can keep the chart defaults or override its color, thickness, spacing, and draw mode.
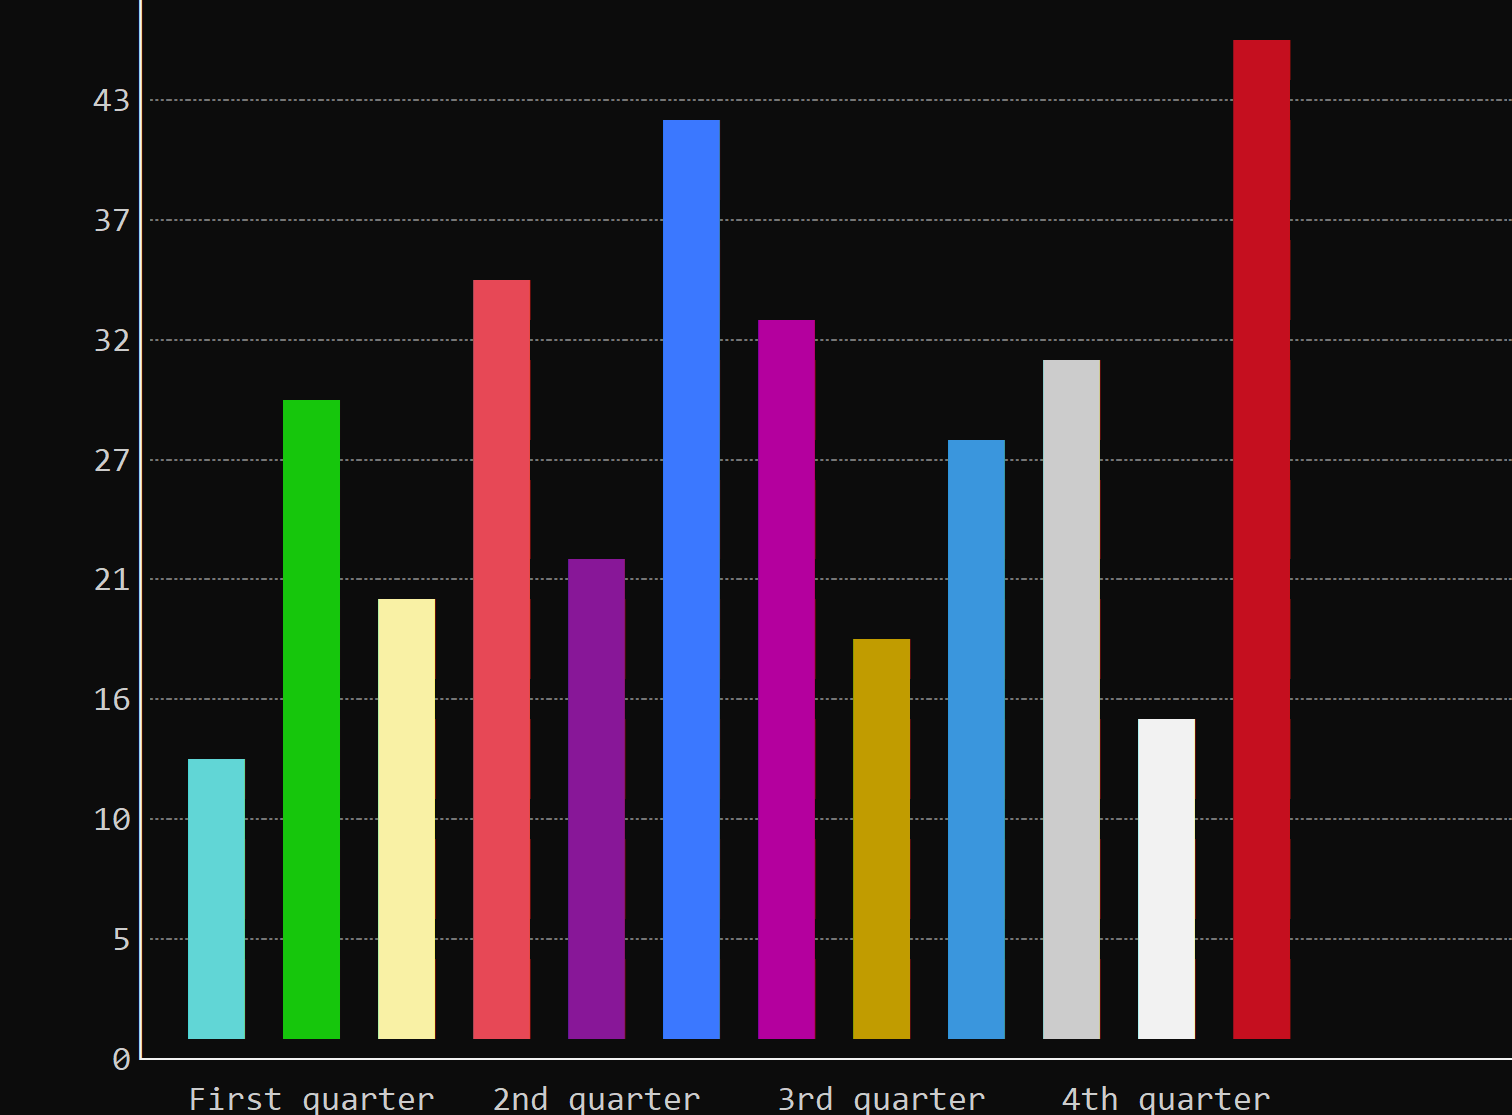
Create one with VBarChart::new (a layout and initialization flags) or with the vbarchart! macro. With VBarChart::new, name the numeric type on the variable or with a turbofish:
let chart: VBarChart<i32> = VBarChart::new(layout!("d:f"), vbarchart::Flags::ScrollBars);
let chart = VBarChart::<f64>::new(layout!("d:f"), vbarchart::Flags::None);
The macro takes the numeric type as its first parameter:
let c1 = vbarchart!("i32,d:f");
let c2 = vbarchart!("class:i32,x:1,y:1,w:60,h:20,flags:[ScrollBars,ShowZeroLineOnYAxis]");
let c3 = vbarchart!("f64,d:f,scale:Fit,xlabels:BarLabels,bar-width:3,values:[1.5,2.0,0.5,3.25]");
A new chart starts empty. It scales bars with BarScale::FromZero, shows the Y axis and its grid (6 characters wide, a label every 3 rows), and draws no X axis. Bars use the theme color, a thickness of 1, a spacing of 1, and a solid fill. Integer values are formatted with thousands separators. Floating-point values are formatted with two decimals.
A VBarChart supports all common parameters (as they are described in Instantiate via Macros section). Besides them, the following named parameters are also accepted:
| Parameter name | Type | Positional parameter | Purpose |
|---|---|---|---|
class or type | String | Yes (first) | Numeric type of the series (i32, f64, …) |
flags | Flags | No | Initialization flags |
values or data | List | No | Bars to add. Each item is a number or a bar description |
scale or barscale or bar-scale | String | No | How values map onto the plot height |
xlabels or x-labels or xl or xaxis or x-axis | String or List | No | Labels drawn under the bars |
bar-width or barwidth or bw or default-bar-width or dbw | Integer | No | Default bar thickness, from 1 to 100 |
spacing or space or s or bar-spacing or default-bar-spacing or dbs | Integer | No | Default gap before a bar, from 1 to 100 |
draw-mode or dm or bar-draw-mode or default-bar-draw-mode or dbdm | String | No | Default way to paint a bar |
bar-color or barcolor or bar-attr or barattr or default-bar-draw-mode-attr | Dict | No | Default character attribute for bars |
numeric-format or nf | Dict | No | Format used for Y-axis labels and hover tooltips |
yaxis-width or y-axis-width or yw | Integer | No | Characters reserved for Y-axis labels (0 to 32; 0 is treated as 1) |
yaxis-step or y-axis-step or ystep or step | Integer | No | Rows between horizontal grid lines (1 to 255) |
lsm or left-scroll-margin | Integer | No | Left margin of the horizontal scroll bar |
Flags
vbarchart::Flags::ScrollBarsorScrollBars(for macro initialization) — shows a horizontal scroll bar when the bars are wider than the control. The bottom margin grows while the chart has focus so the scroll bar stays visible.vbarchart::Flags::DimBarsOnSelectionorDimBarsOnSelection(for macro initialization) — after a bar is selected, the other bars are drawn with the inactive chart color. The selected bar is outlined with the theme selection border.vbarchart::Flags::ShowZeroLineOnYAxisorShowZeroLineOnYAxis(for macro initialization) — draws a solid horizontal line at value zero while the Y-axis grid is visible.
let chart = vbarchart!("i32,d:f,flags:[ScrollBars,DimBarsOnSelection,ShowZeroLineOnYAxis]");
Scale
scale chooses how bar values become heights. The same values are available from set_bars_scale as vbarchart::BarScale<T>.
FromZeroorzero— every bar is drawn from zero. The visible range includes zero and every bar value. This is the default.FromZeroMinRange(min, max)orzero-min-range(min, max)— same asFromZero, and the range is also expanded so that it coversminandmax.FitDataorfit— the smallest and largest bar values stretch across the full plot height. When every value is equal, each bar is drawn at half the plot height.Fixed(min, max)orfix(min, max)— uses a fixed range. Values outside it are drawn at the corresponding edge of the plot. Whenminis not lower thanmax, every bar is drawn at half the plot height.
let fit = vbarchart!("f64,d:f,scale:Fit");
let fixed = vbarchart!("i32,d:f,scale:Fixed(0,100)");
let padded = vbarchart!("i32,d:f,scale:FromZeroMinRange(-20,80)");
X-axis labels
xlabels chooses the labels under the bars. The same modes are available from set_xaxis_label_mode as vbarchart::XAxisLabelMode.
None— draws no X axis. This is the default.Index(start)— labels each bar withstart + bar index.Index(1)labels the first bar1, the next2, and so on.BarLabels— uses each bar’s own label. Bars with an empty label are skipped.- A list of spans — each span covers a run of bars. A span is
{start, count, label}.startis the zero-based index of the first bar, andcountis how many bars the label covers (a count below 1 is treated as 1). Named fields arestart,count(also accepted asend), andlabel(alsotextorcaption). The second value is always a count of bars.
Spans are copied into the chart, ordered by start index and then by end index. A span that overlaps an earlier one is dropped. A span label is stored in a 22-character buffer.
let by_index = vbarchart!("i32,d:f,xlabels:Index(2020)");
let by_name = vbarchart!("i32,d:f,xlabels:BarLabels,values:[{10,label:'Jan'},{12,label:'Feb'}]");
let by_span = vbarchart!("i32,d:f,xlabels:[{0,3,'Q1'},{3,3,'Q2'}]");
The same spans from code:
let spans = [BarSpan::new(0, 3, "Q1"), BarSpan::new(3, 3, "Q2")];
chart.set_xaxis_label_mode(vbarchart::XAxisLabelMode::Custom(&spans));
BarSpan::new(0, 3, "Q1") labels bars 0, 1, and 2. Inserting or deleting bars does not rewrite these spans; update them after the series changes.
Bars
A bar stores a numeric value and an optional label. Color, thickness, spacing, and draw mode are also optional: a field left unset uses the chart default. A value of type T converts into a bar, so chart.add_bar(10) and a bare number in values are enough for a default bar.
Build a bar that overrides the defaults with BarBuilder:
let bar = BarBuilder::new(42)
    .label("Jun")
    .thickness(4)
    .spacing(2)
    .attr(CharAttribute::with_fore_color(Color::Yellow))
    .draw_mode(BarDrawMode::Fill(BarFillType::Shade50))
    .build();
chart.add_bar(bar);
In the values (or data) list, a dictionary describes the same fields. value is required. The other fields are optional.
| Parameter name | Type | Positional parameter | Purpose |
|---|---|---|---|
value or val or v | Number | Yes (first) | The bar value |
width or w or thickness | Integer | No | Thickness in cells |
space or spacing or s | Integer | No | Gap, in cells, before this bar |
label or text or caption | String | No | Label used by BarLabels and by the hover tooltip |
attr or attribute or charattr | Dict | No | Character attribute for this bar |
draw-mode or drawmode or dm or mode | String | No | Draw mode for this bar |
let chart = vbarchart!("i32,d:f,values:[10,{25,label:'Mar',width:4,attr:yellow},{40,dm:Fill(Shade50),space:2}]");
Draw mode
BarDrawMode selects the glyph used to paint a bar. The default is Fill(Solid). Some modes force the thickness into a fixed range; a thickness outside that range is clamped when the bar is painted.
| Mode | Macro form | Thickness |
|---|---|---|
Fill(fill) | Fill, Fill(Solid), Fill(Shade50), Fill('#') | at least 1 |
Line(line) | Line, Line(Single), Line(Double) | always 1 |
Rectangle(line) | Rectangle or Rect, Rectangle(Double) | at least 2 |
FilledRectangle(line) | FilledRectangle or FilledRect | at least 3 |
Point(marker) | Point(Bullet), Point(Diamond), Point('*') | always 1 |
LargePoint(marker) | LargePoint, LargePoint(Circle) | always 3 (a 3-by-2 marker) |
Cap(cap) | Cap, Cap(SingleLine), Cap('=') | at least 1 |
A mode written without parentheses uses its default inner value: Fill is solid, Line / Rectangle / FilledRectangle use a single line, LargePoint is a rounded square, and Cap is solid. Write the point marker explicitly, for example Point(Bullet).
Fill accepts Solid (█), Shade75 (▓), Shade50 (▒), Shade25 (░), Braille, Checkerboard, Grid, GridDouble, CrossHatch, Dashed, DiagonalUp, DiagonalDown, Notched, or Custom(char). In the macro, a custom glyph is a character (Fill('#')) or a code (Fill(code: 0x2591)).
Line, Rectangle, and FilledRectangle take a LineType: Single, Double, SingleThick (thick), Border, Ascii, AsciiRound, SingleRound (round), or Braille.
Point accepts Bullet (●), Diamond (◆), Square (■), or a custom character.
LargePoint accepts RoundSquare, Square, DoubleLineSquare, ThickSquare, Circle, Diamond, or a custom character that fills the 3-by-2 block.
Cap accepts Solid, Shade75, Shade50, Shade25, Braille, SingleLine, DoubleLine, SingleThickLine (thick), or a custom character. The cap is a single row drawn at the bar’s value.
chart.set_default_bar_drawmode(BarDrawMode::Rectangle(LineType::Double));
chart.update_bar(0, |bar| {
    bar.set_draw_mode(BarDrawMode::Point(BarPointType::Diamond));
});
Number format
numeric-format (or set_number_format) controls the text used for Y-axis labels, the zero-line label, and hover tooltips. The first value is the base: dec / 10, hex / 16, oct / 8, or bin / 2. Optional fields include decimals (or precision, at most 8), group (0, 3, or 4) with sep, prefix, suffix, and digits.
let chart = vbarchart!("f64,d:f,numeric-format:{dec,decimals:1}");
let hex = vbarchart!("i32,d:f,nf:{hex,prefix:0x}");
Events
To intercept events from a VBarChart, implement VBarChartEvents<T> on the window that runs the event loop. The attribute events = VBarChartEvents<T> generates the trait. Both methods are required.
pub trait VBarChartEvents<T> {
    fn on_bar_selected(&mut self, handle: Handle<VBarChart<T>>, index: u32) -> EventProcessStatus;
    fn on_clear_selection(&mut self, handle: Handle<VBarChart<T>>) -> EventProcessStatus;
}
on_bar_selected runs when a click or double-click lands on a bar that was not already selected. index is the zero-based bar index. on_clear_selection runs when a click or double-click lands outside every bar and a bar was selected. Clicking the bar that is already selected does not raise the event again.
Methods
Besides the Common methods for all Controls, a VBarChart also has the following additional methods:
| Method | Purpose |
|---|---|
add_bar(...) | Appends one bar and repaints. The argument is a value of type T or any type that converts into a Bar |
add_bars(...) | Appends several bars and repaints once |
bars_count() | Returns the number of bars |
selected_bar() | Returns the index of the selected bar, or None |
get_bar(index) | Returns Some(&Bar<T>), or None if index is out of range |
update_bar(index, f) | Mutates one bar, then relayouts and repaints. Does nothing if index is out of range |
update_bars(f) | Mutates the whole series through a Bars view, then relayouts and repaints once |
ensure_visible(index) | Scrolls horizontally so the bar at index is visible. Does nothing if index is out of range or the bar is already fully visible |
set_bars_scale(...) | Sets the BarScale used to map values onto the plot height |
set_number_format(...) | Sets the FormatNumber used for axis labels and tooltips |
set_default_bar_width(...) | Sets the thickness, in cells, of bars that do not specify their own. Values below 1 are treated as 1 |
set_default_bar_spacing(...) | Sets the gap, in cells, before bars that do not specify their own |
set_default_bar_drawmode(...) | Sets the draw mode of bars that do not specify their own |
set_default_bar_attr(...) | Sets the character attribute of bars that do not specify their own. After this call, bars no longer use the theme bar color |
set_yaxis_visible(...) | Shows or hides the Y axis and the column reserved for its labels |
set_yaxis_show_grid(...) | Shows or hides the horizontal grid lines and the numeric labels beside them |
set_yaxis_width(...) | Sets how many characters are reserved for Y-axis labels. Values below 1 are treated as 1. Used only while the Y axis is visible |
set_yaxis_step(...) | Sets the distance, in rows, between horizontal grid lines. Values below 1 are treated as 1 |
set_xaxis_label_mode(...) | Sets how labels are drawn under the bars |
Editing the series (Bars)
update_bars passes a Bars view so several inserts, deletes, and in-place edits share one repaint.
| Method | Purpose |
|---|---|
len() / is_empty() | Size of the series |
get(index) / get_mut(index) | Borrow one bar, or None if out of range |
add(...) / add_bars(...) | Append one bar or several bars |
insert(index, bar) | Inserts at index. Returns false if index is greater than len() |
delete(index) | Removes the bar and returns it, or None if out of range |
set(index, bar) | Replaces the bar and returns the previous one, or None if out of range |
clear() | Removes every bar |
iter() / iter_mut() | Walk the series |
chart.update_bars(|bars| {
    bars.get_mut(1).unwrap().set_value(20);
    bars.insert(0, 0);
    bars.delete(3);
});
Bar
On a bar returned by get_bar, Bars::get, or passed into update_bar:
| Method | Purpose |
|---|---|
value() / set_value(...) | Read or replace the numeric value |
label() / set_label(...) | Read or replace the label |
attr() / set_attr(...) / clear_attr() | Bar color, or the chart default when cleared |
thickness() / set_thickness(...) / clear_thickness() | Bar thickness, or the chart default when cleared |
spacing() / set_spacing(...) / clear_spacing() | Gap before the bar, or the chart default when cleared |
draw_mode() / set_draw_mode(...) / clear_draw_mode() | Draw mode, or the chart default when cleared |
Setters return &mut Self, so they can be chained.
Key association
The following keys are processed by a VBarChart when it has focus. They scroll the plot horizontally.
| Key | Purpose |
|---|---|
Left / Right | Scroll one cell toward the start or the end of the series |
Home | Scroll to the start of the series |
End | Scroll to the end of the series |
Ctrl+Left / Ctrl+Right | Make the previous or next bar the first visible bar |
Mouse association
| Action | Purpose |
|---|---|
| Hover | Shows a tooltip over the bar under the cursor. The tooltip is the formatted value, or the label and the value when the bar has a label |
| Click or double-click on a bar | Selects that bar and raises on_bar_selected when the selection changes. The click has to land on the painted bar |
| Click or double-click outside a bar | Clears the selection and raises on_clear_selection when a bar was selected |
| Wheel left or wheel up | Scrolls one cell toward the start of the series |
| Wheel right or wheel down | Scrolls one cell toward the end of the series |
| Drag the scroll bar | Scrolls the series when ScrollBars is enabled |
Example
The following window shows four monthly values. Selecting a bar writes that month and its value into the window title. Clearing the selection restores the original title.
A larger editor (per-bar appearance, axes, scale, and X-axis groups) is in examples/vbarchart_editor.
use appcui::prelude::*;

#[Window(events = VBarChartEvents<i32>)]
struct MyWin {
    chart: Handle<VBarChart<i32>>,
}

impl MyWin {
    fn new() -> Self {
        let mut win = MyWin {
            base: window!("Sales,d:f"),
            chart: Handle::None,
        };
        let mut chart = vbarchart!(
            "i32,d:f,
             flags:[ScrollBars,ShowZeroLineOnYAxis],
             xlabels:BarLabels,
             bar-width:3,
             spacing:1,
             draw-mode:Fill(Shade50),
             bar-color:aqua"
        );
        chart.add_bars([
            BarBuilder::new(12).label("Jan").build(),
            BarBuilder::new(18).label("Feb").build(),
            BarBuilder::new(9).label("Mar").build(),
            BarBuilder::new(22).label("Apr").build(),
        ]);
        win.chart = win.add(chart);
        win
    }
}

impl VBarChartEvents<i32> for MyWin {
    fn on_bar_selected(&mut self, handle: Handle<VBarChart<i32>>, index: u32) -> EventProcessStatus {
        if let Some(chart) = self.control(handle) {
            if let Some(bar) = chart.get_bar(index as usize) {
                let title = format!("Sales - {} = {}", bar.label(), bar.value());
                self.set_title(&title);
            }
        }
        EventProcessStatus::Processed
    }

    fn on_clear_selection(&mut self, _: Handle<VBarChart<i32>>) -> EventProcessStatus {
        self.set_title("Sales");
        EventProcessStatus::Processed
    }
}

fn main() -> Result<(), appcui::system::Error> {
    App::new().window(MyWin::new).run()
}